
“Intersectionality” is one of those divisive buzzwords adopted by people on the left and ridiculed by people on the right. If you believe the alt-right narrative, intersectionality is a tool that liberals use in order to feel bad about themselves: not only am I downtrodden African American, the narrative goes, but I’m intersectionally both African American and gay, a double victim.
However, the actual definition of intersectionality is simpler and much more meaningful: discrimination might not appear when you look at individual factors, like race, gender, or income: discrimination (or differences in outcomes) might only appear when multiple factors are taken into account.
In this blog post I’m going to argue that anyone who disagrees with the intersectionality as a tool for analyzing discrimination is ignorant of basic marginal statistics. I’ll start off by introducing a made-up dataset and tools to analyze it. It will become apparent that the most useful tools for understanding this kind of data are “intersectional.”
The Data
Let’s pretend that the total population of all people in the USA is about 80% white and 20% black, with about half of each of those groups being male and the other half female. Now let’s take a representative sample of 100 doctors out of all the doctors in the USA. We would expect, a-priori, that a random sample of doctors, who are themselves a random sample of the American population, should be representative: 20% black, 80% white, half male/female: in other words: 10% black women, 10% black men, 40% white women, and 40% white men. Now let’s look at our representative sample of doctors:
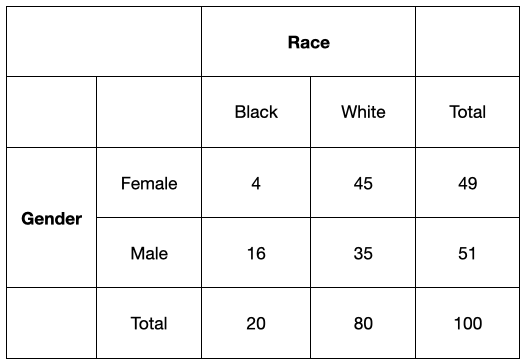
Check out the margins of this graph: there are 49 women and 51 men – just about equal – and 20 black doctors and 80 white doctors: what you’d expect. If we restrict ourselves to just looking at the margins, then there are no obvious problems and we can all go home. But why restrict ourselves to just examining the margins?
Let’s dig a little deeper check out the inner boxes of this graph, where race and gender intersect. Notice that there are only 4 black female doctors: less than half of the 10 you’d expect. There are slightly more white female and black male doctors than you’d expect, but there seems to be really significant under-representation of black female doctors.
These two approaches - looking at the margins and looking at the itersections - are different tools for interpreting data. If you don’t agree that an intersectional approach to identifying discrimination is useful, you’re essentially saying that we should only pay attention to the margins and not look inside the boxes.
Problems
Analyzing discrimination using broad categories like gender, ethnicity, religion, and income can be useful. However, problems emerge when too many factors are considered. For instance, I guarantee that you can find one group - maybe elderly Tasmanian chimney sweeps - that will be over- or under-represented in a given sample.
While this seems like it might present huge issues to understanding discrimination (at how many factors do we draw the line?), it actually doesn’t: identifying unequal outcomes (not enough black female doctors), isn’t where the analysis ends, it’s where it starts. Once you identify an unequal outcome, then you can start uncovering the reasons that might cause it. Sometimes the reason is systematic racism, sometimes it’s something trivial (very few Spanish-speakers showed up because the signs were only printed in English), and sometimes it’s simply random variation.
Intersectionality is not controversial if you’re used to analyzing data and interpreting data. The only people who want to exclude intersectionality from our analysis toolkit are those who have an ideological reason for doing so.